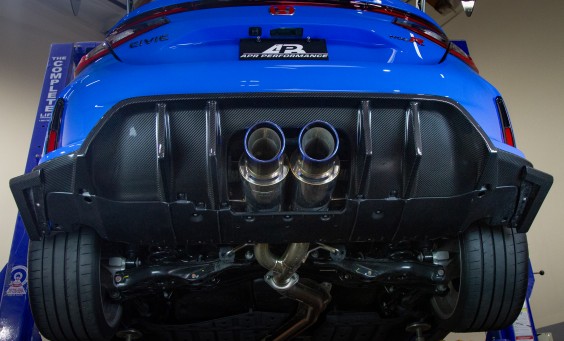
APR PerformanceAPR ProjectsMotorsportsGalleryTech ArticlesReseller Locator
Products
ADJUSTABLE WINGS
AERODYNAMIC KITS
AIR DUCTS
FLEX CONTROL BARS
FORMULA GT3 MIRRORS
FRONT AIR DAMS
FRONT BUMPER CANARDS
FRONT WIND SPLITTERS
RADIATOR COOLING PLATES
REAR DECK SPOILERS
REAR DIFFUSERS
SIDE ROCKER EXTENSIONS
online_shopping
Online Store
dress-up-items
Carbign Craft
Vehicle Applications
Search
GTC-200 - CFD Data
Adjustable Wings >> GTC-Series >> GTC-200 CFD Data

OVERVIEW

Contained herein are the data and results of the Computational Fluid Dynamics (CFD) analysis that was conducted on the GTC-200 airfoil. This data illustrates how the airfoil performs in different conditions by comparing Downforce vs. Angle-of-Attack (AOA) vs. Speed, and Drag vs. AOA vs. Speed. This data will provide insight with regards to how and how much the airfoil performs with respect to these conditions. To find out more about what CFD is, please visit our CFD Tech Article page.

To learn how to interpret and apply this type of CFD data, see the sample analysis write-ups at the GTC-300 CFD Data & Analysis page.


CFD DATA (TABLES)

The following table shows the actual data that were collected from the CFD analysis. The numbers in the table are represented in Newtons (a unit of force). To convert to "pounds," divide the numbers by 4.44822 (where 1 Newton (N) = 4.44822 Pounds-force (lbf)). For example, a downforce of 1286.89 N would equal 289.3 lbf.


The following image illustrates where and how the AOA is referenced. At 0 degrees AOA, the reference plane is parallel to the direction of the free air stream (the stream would travel from right-to-left in this image). This reference plane can be simulated by placing a ruler across the top of the center section of an actual airfoil.


CFD DATA (RENDERED IMAGES)

The following image illustrates the pressure distributions across the surfaces of the airfoil. The units are in Pascals (Pa), where 1 Pa = 1.45 x 10^-4 Pound Per Square Inch (lb/in^2).


The following image illustrates both the pressure distribution and streamlines associated with the airfoil.


The following image illustrates both the pressure distributions and vector fields around the airfoil.


See Applications


The information contained herein is property of APR Performance, and may not be reproduced in whole or in part without prior written consent from APR Performance.